Sales Report
Sales Report Feature Overview
Sales Report is a business data summary screen that helps administrators quickly track orders, revenue, customers, and product performance over specific time periods.
This feature supports:
- Evaluating overall business performance
- Tracking revenue increase/decrease trends
- Analyzing customer behavior
- Identifying best-selling products and high-revenue generators
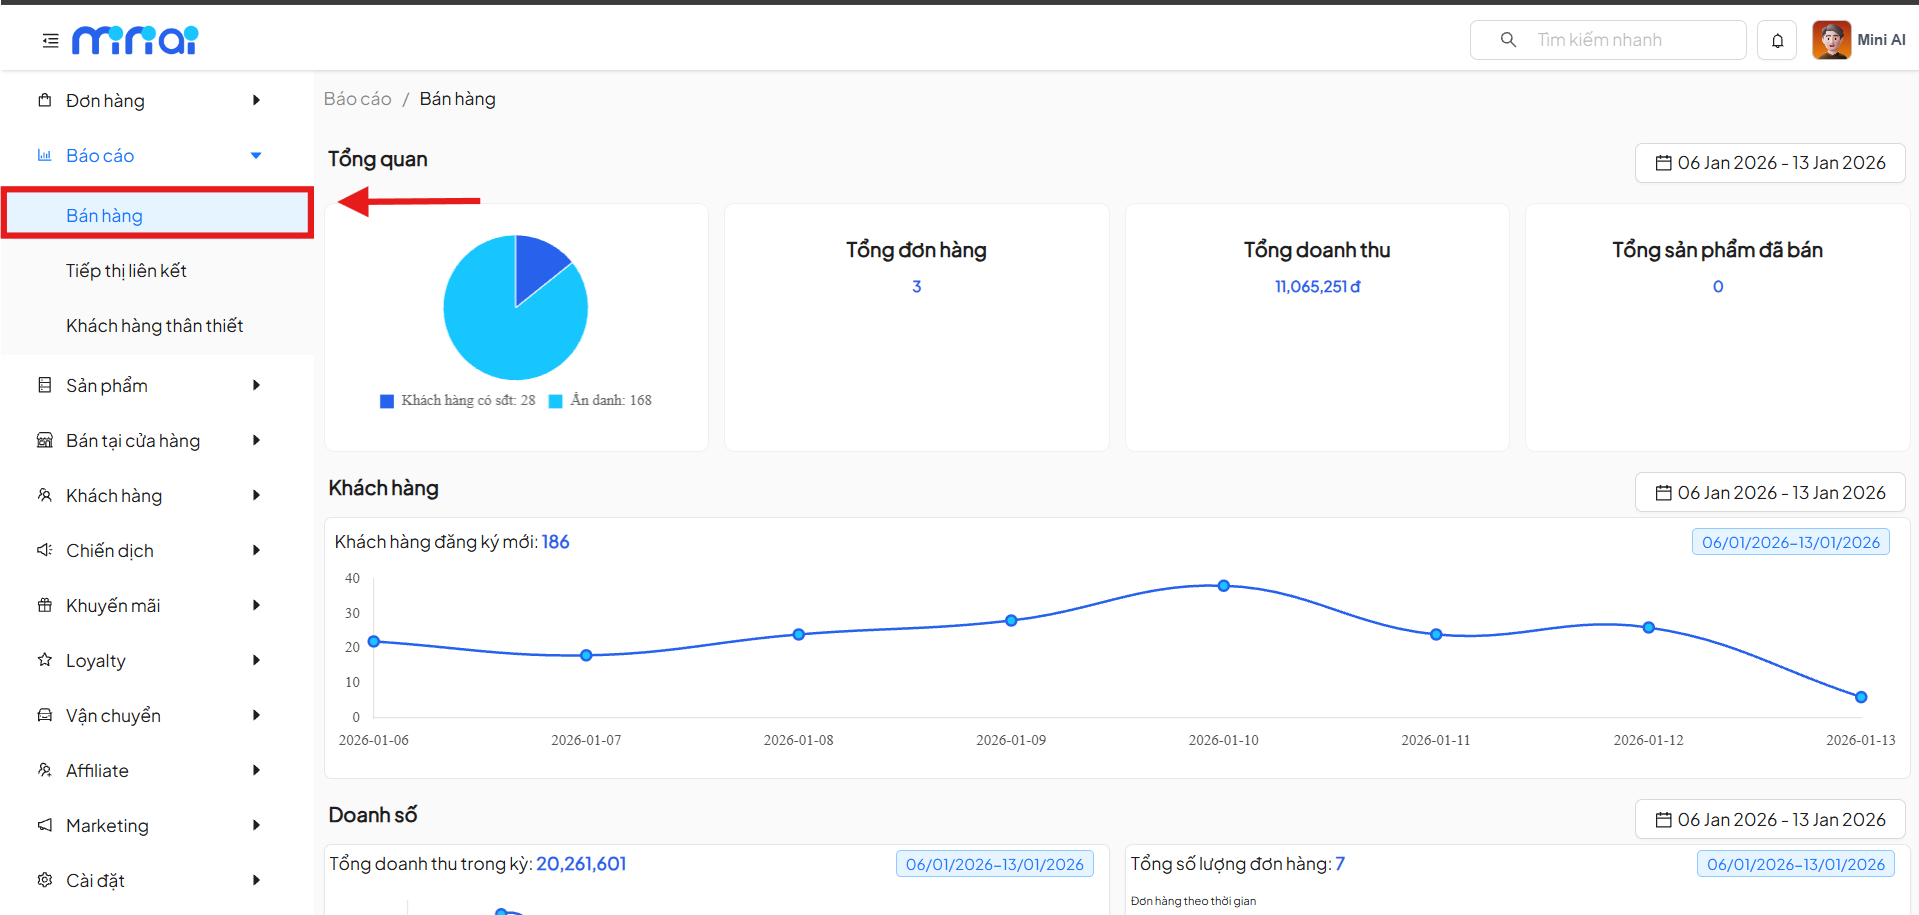
Accessing the Sales Report
To access the Sales Report feature, follow these steps:
- From the left menu, select Reports
- Click on Sales
- The system displays the Reports / Sales screen
Overview Section
The Overview section provides a quick look at sales performance within the selected time period.
Displayed Metrics
- Customer Chart
- Registered customers
- Anonymous customers
- Total Orders: Total number of orders generated in the period
- Total Revenue: Total value of recorded orders
- Total Products Sold: Total quantity of products sold
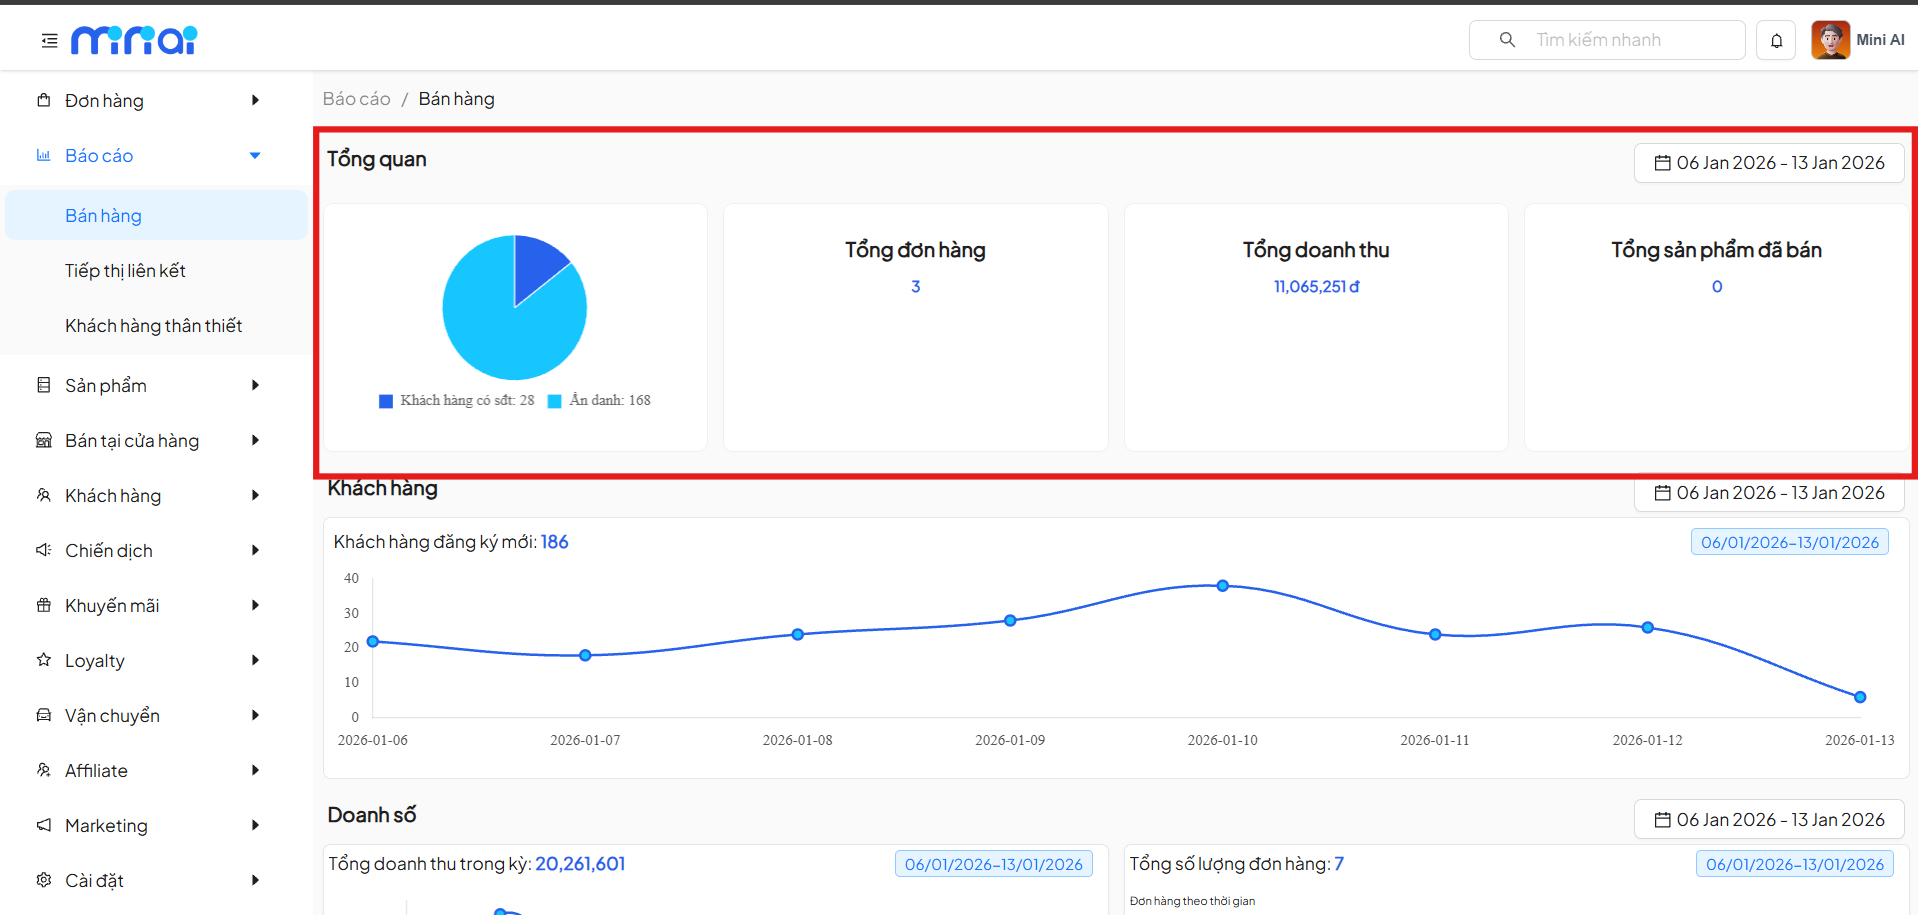
Data in the Overview section will change according to the time period you select in the time filter. These metrics help quickly evaluate sales performance within a specific time frame.
Customer Statistics
The Customer section displays a chart of newly registered customers by day.
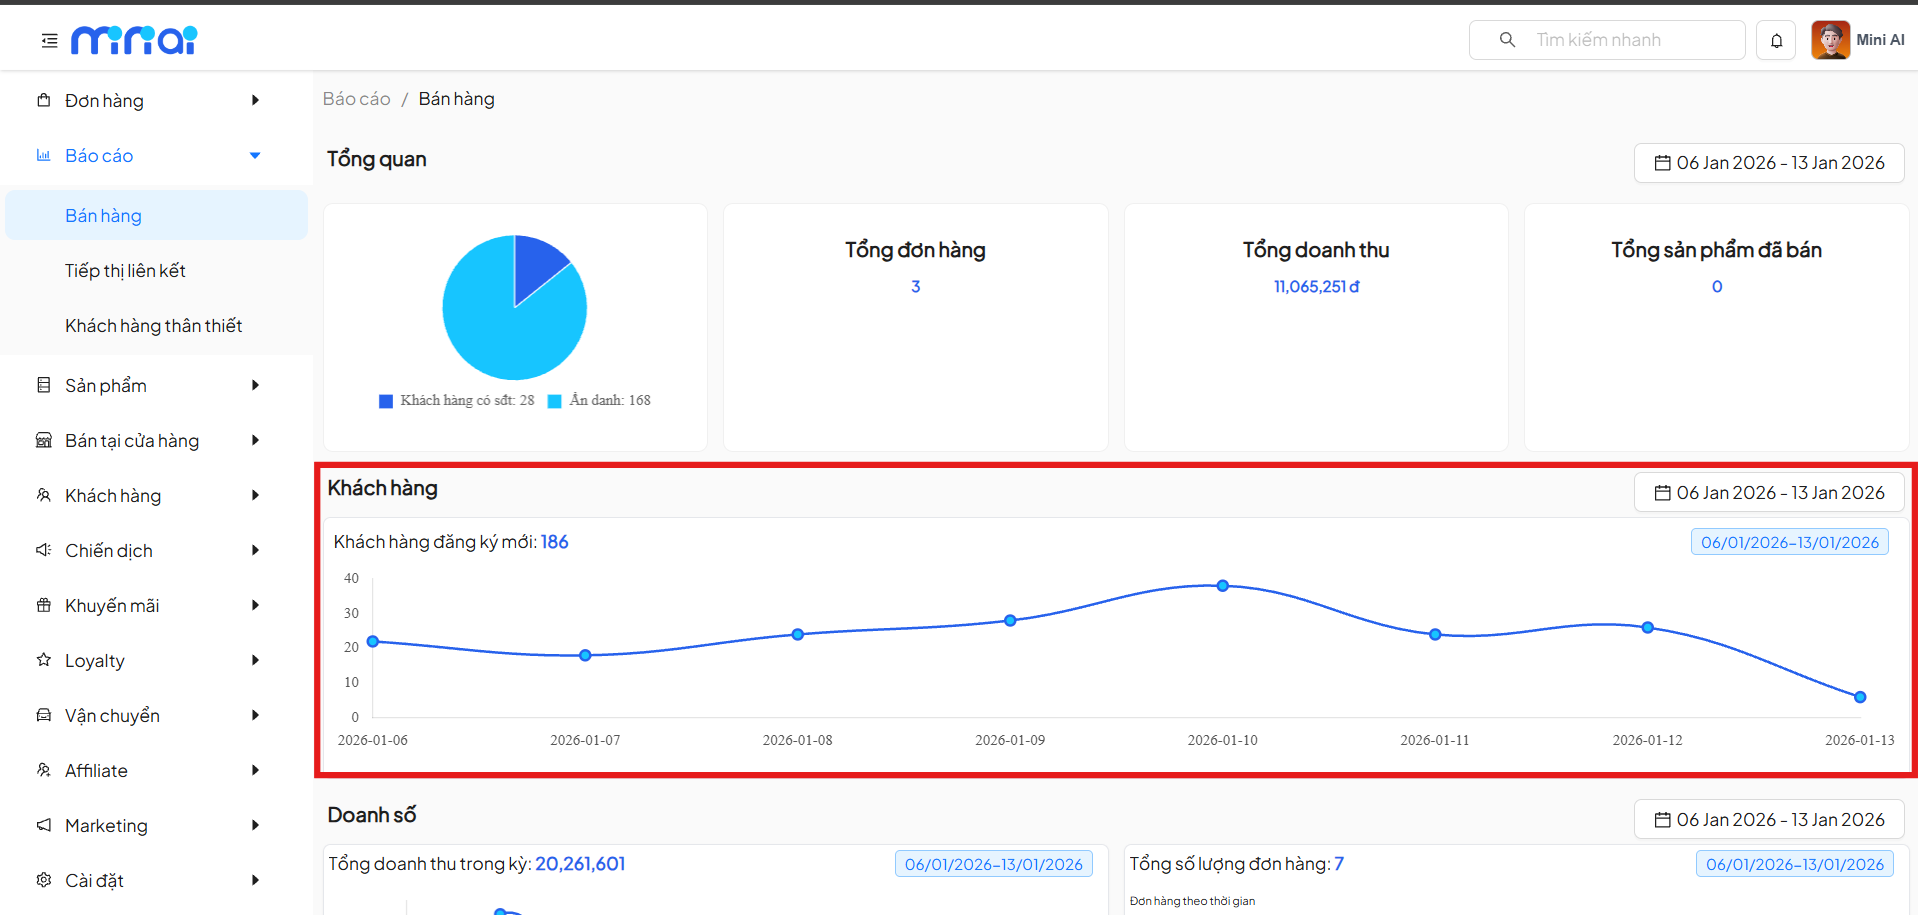
Content Includes
- Total newly registered customers
- Customer growth chart over time
Through this chart, administrators can:
- Track customer increase/decrease trends
- Evaluate the effectiveness of marketing campaigns
- Identify peak registration periods
Sales Analysis
The Sales section provides detailed charts related to sales activities.
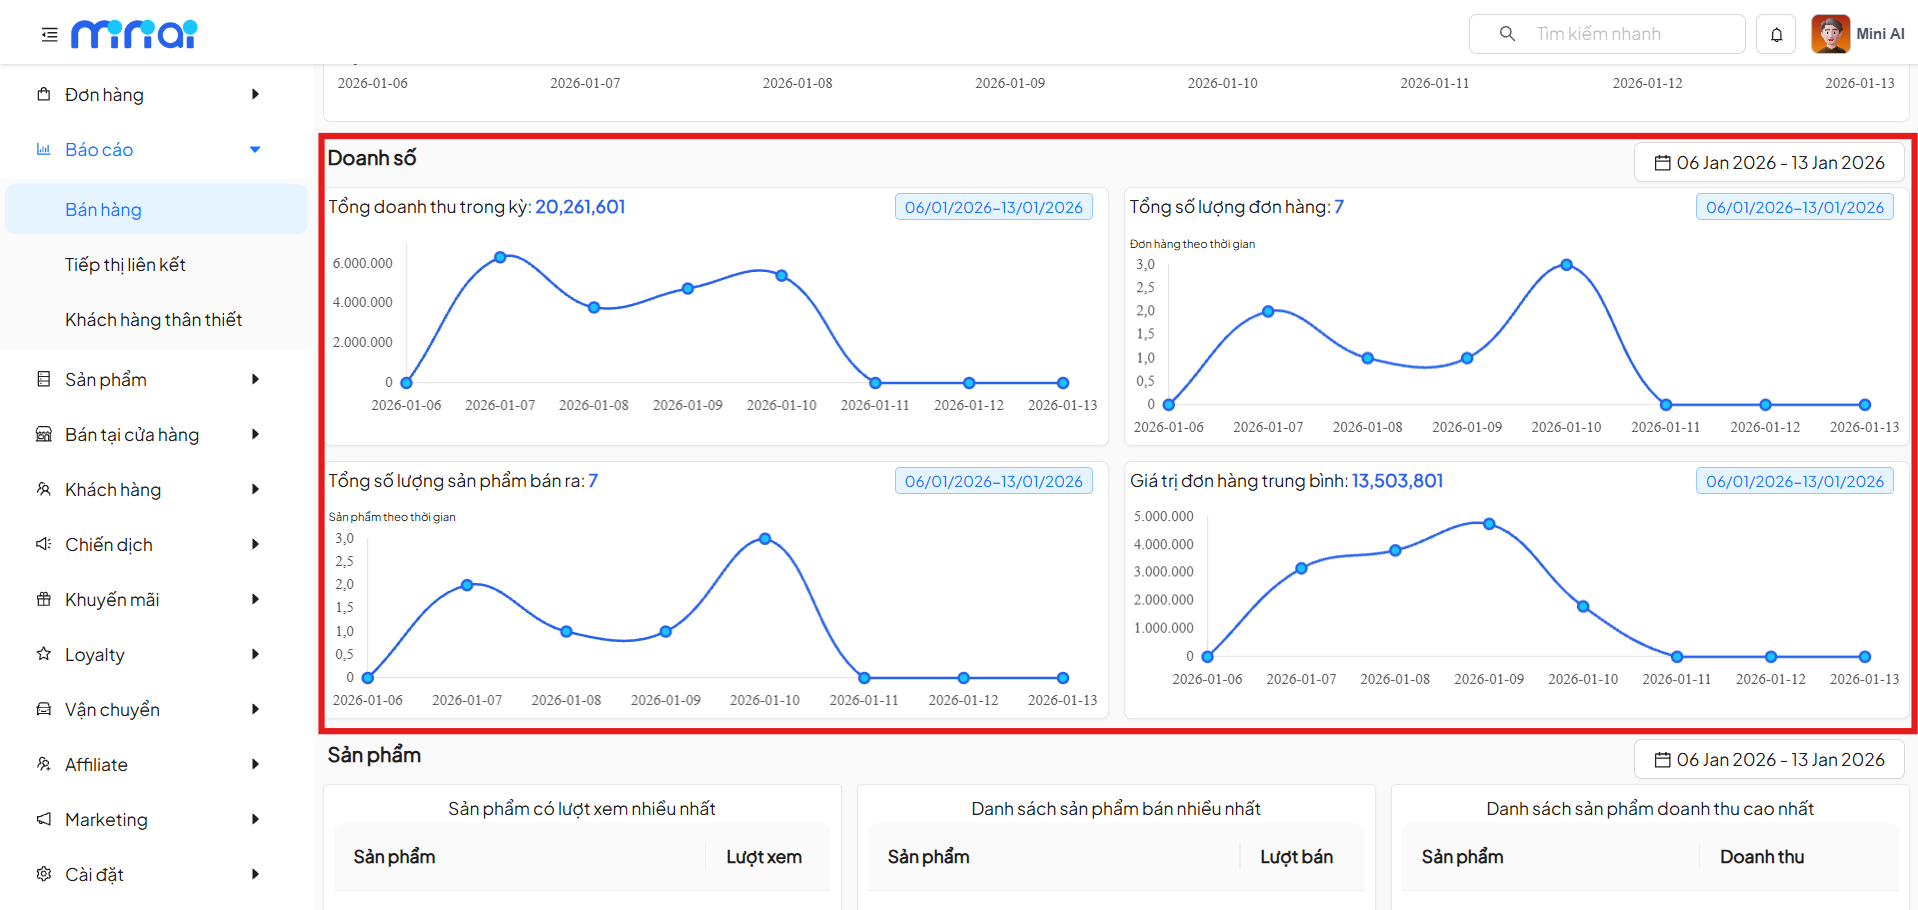
Charts Include
1. Revenue Over Time
- Displays total revenue generated per day
- Helps identify the most effective sales days
2. Number of Orders
- Shows orders generated per day
- Analyzes the stability of sales activities
3. Number of Products Sold
- Tracks total products sold over time
- Supports market demand evaluation
4. Average Order Value
- Shows the average spending per order
- Helps evaluate customer shopping behavior
Product Statistics
The Product section helps administrators analyze the performance of each product.
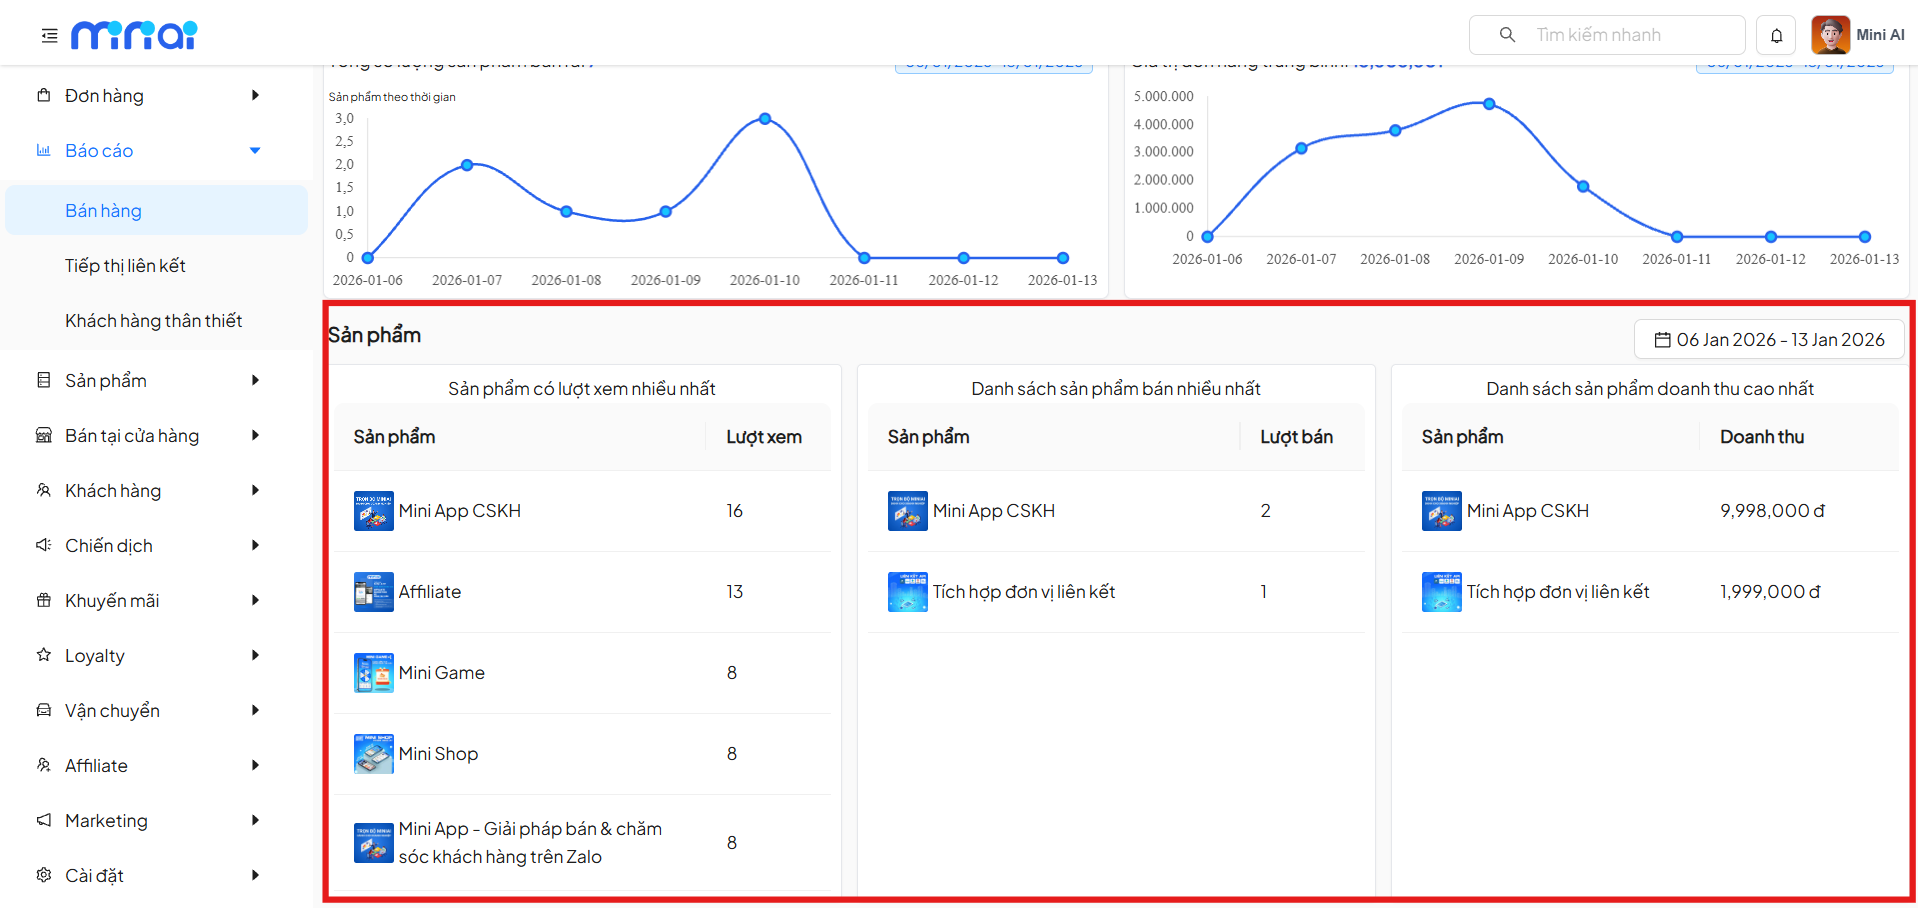
Product Statistics List
1. Most Viewed Products
- Displays products with the most interest
- Suitable for evaluating display and marketing effectiveness
2. Best-Selling Products
- List of products with the highest sales volume
- Supports identifying key products
3. Highest Revenue Products
- Statistics on products generating the most revenue
- Helps prioritize appropriate business strategies
Time Filter
All report sections support time range filtering.
How to Use
- Click on the date picker icon
- Select the desired time range
- The system automatically updates all data according to the selected time
Using the time filter helps compare business performance between different periods.
Benefits of Using the Sales Report
- Track business data in real-time
- Make fast and accurate decisions
- Detect growth or decline trends early
- Optimize sales and marketing strategies
Notes
- Report data depends on orders recorded in the system
- Shorter time ranges provide more detailed data
- Regular report monitoring is recommended for timely strategy adjustments
Conclusion
The Sales Report feature is an important tool for managing and optimizing business operations. Effective use of the report will help businesses understand sales performance, know their customers better, and improve business efficiency.